Every indicator gets a status, indicating if it was processed successfully or not.
Successful processing
If an indicator has been processed successfully, it gets one of the following three states:
Without indications The complete data set was analyzed, but no document has been marked by the indicator.
With indications The data set was analyzed successfully and documents have been marked by the indicator.
Restricted Some documents have been marked by the indicator, but not all documents with indications are part of the result set. This occurs when the indications exceed a certain threshold. The default threshold is set to 30,000 per indicator. As admin user you may in- or decrease this value in the config menu in the top right corner. But be aware: The set threshold guarantees a good tradeoff between processing duration and the number of results. Usually, only large data sets will have restricted indicators.
For each restricted indicator and its profiles, the number of documents is shown in the tooltip, as
if the indicator was not restricted ("restricted full count"). Since the indicator is restricted,
the algorithm reduces "similar cases" for each profile. As a result, the profiles can yield less than the treshold of 30,000 documents.
Also, the number of profiles remains the same, and the ratio of documents between these profiles remains approximately the same as if the indicator was not restricted. However, there are less documents with indications in each profile.
Processing failed
Extensive automated data analysis take up resources and can be influenced by a variety of factors. Therefore different events can cause a failed processing, as described below:
Failed An internal error occurred, and the processing of this indicator failed. Please fill out this form for more detailed information and provide your log.
Missing data Some data are missing to successfully process this indicator. This may have several causes. Some examples are:
- Your data extraction is outdated ->
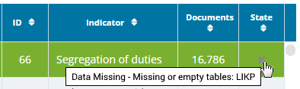 Consider a new data extraction with the current version.
 - The data is not stored in the target SAP system. E.g., when data remains in pre-systems. -> You cannot analyze this with zapAudit!
- The indicator is new and requires tables that have not been part of the data scope at time of extraction -> Consider a new data extraction with the current version.
- If the indicator has marked documents despite data missing, only a subset of hits was determined. You can still evaluate this indicator!
Timeout Processing of this indicator takes more time than a set threshold. The default value is 12h per indicator and can be adjusted by admin users in the config menu. Please contact us and let us know that the indicator runs into the timeout. We are eager to improve our indicators to provide the best processing performance!
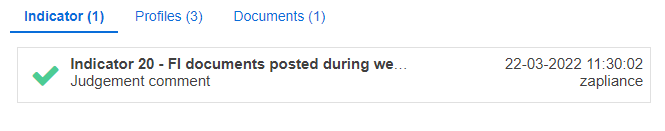
Judge Indicator

There can always be reasons to give one of the following comment statuses. Please document why you choose them in the judgement comment.
Investigated and without complaint, There is no finding for this.
Investigated and with complaint, There is a finding for this.
Investigated and not applicable You investigated the indications and determined that you cannot apply it to the company or the current context. In contrast to Out of Scope, you use Not Applicable as a result of the investigation at the end of the indicator audit.